/www.gundp.ch/file/2140/Elektrische_Felder_Symbolbild.png)
/www.gundp.ch/file/2141/Magnetische_Felder_Symbolbild.png)
Where and how do we measure NIR exposure?
-
Mobile measurements: NIR exposure in outdoor areas and in publicly accessible places is determined by walking along defined routes. These mobile route measurements take place in different environments, such as industrial areas, city centres or natural areas. The measurement technician carries a backpack with the measurement equipment. This additionally allows the measurement of NIR exposure in public transport, at schools or in supermarkets.
-
Spot measurements: In spot measurements, exposure is measured in living spaces where people stay for a longer period of time, e.g. in the living room or bedroom. In addition, all rooms in the properties are walked through and stationary measurements are also taken in the bedroom over 24 hours. Different building types are taken into account.
Selection of the measurement location
Each measurement environment is selected based on its proximity to a NIR source, e.g. mobile radio, broadcasting, power supply or railway power. Electric and magnetic fields are measured both in the mobile route measurements and in the measurements in living rooms. It is ensured that neither the measuring equipment nor the measuring technician (e.g. mobile phone) emit NIR field contributions.
What do the results of the first two years show?
It has been shown that the NIR exposure of the Swiss population is generally only moderately high. In the route measurements, the immission limit values (IGWs), which are intended to protect against damage to health, were exhausted by only 13% for magnetic fields and 6% for electric fields. NIR exposure decreases as the degree of urbanisation decreases. The median values of electric field strength range from 0.29 V/m in industrial areas to 0.07 V/m in natural areas. The median exposure to magnetic fields was found to be 0.03 µT in agricultural areas and 0.19 µT in urban city centres. In public areas, NIR exposure was highest at railway stations, tram and bus stops, as these places are often close to power lines and many mobile phone subscribers stay there.
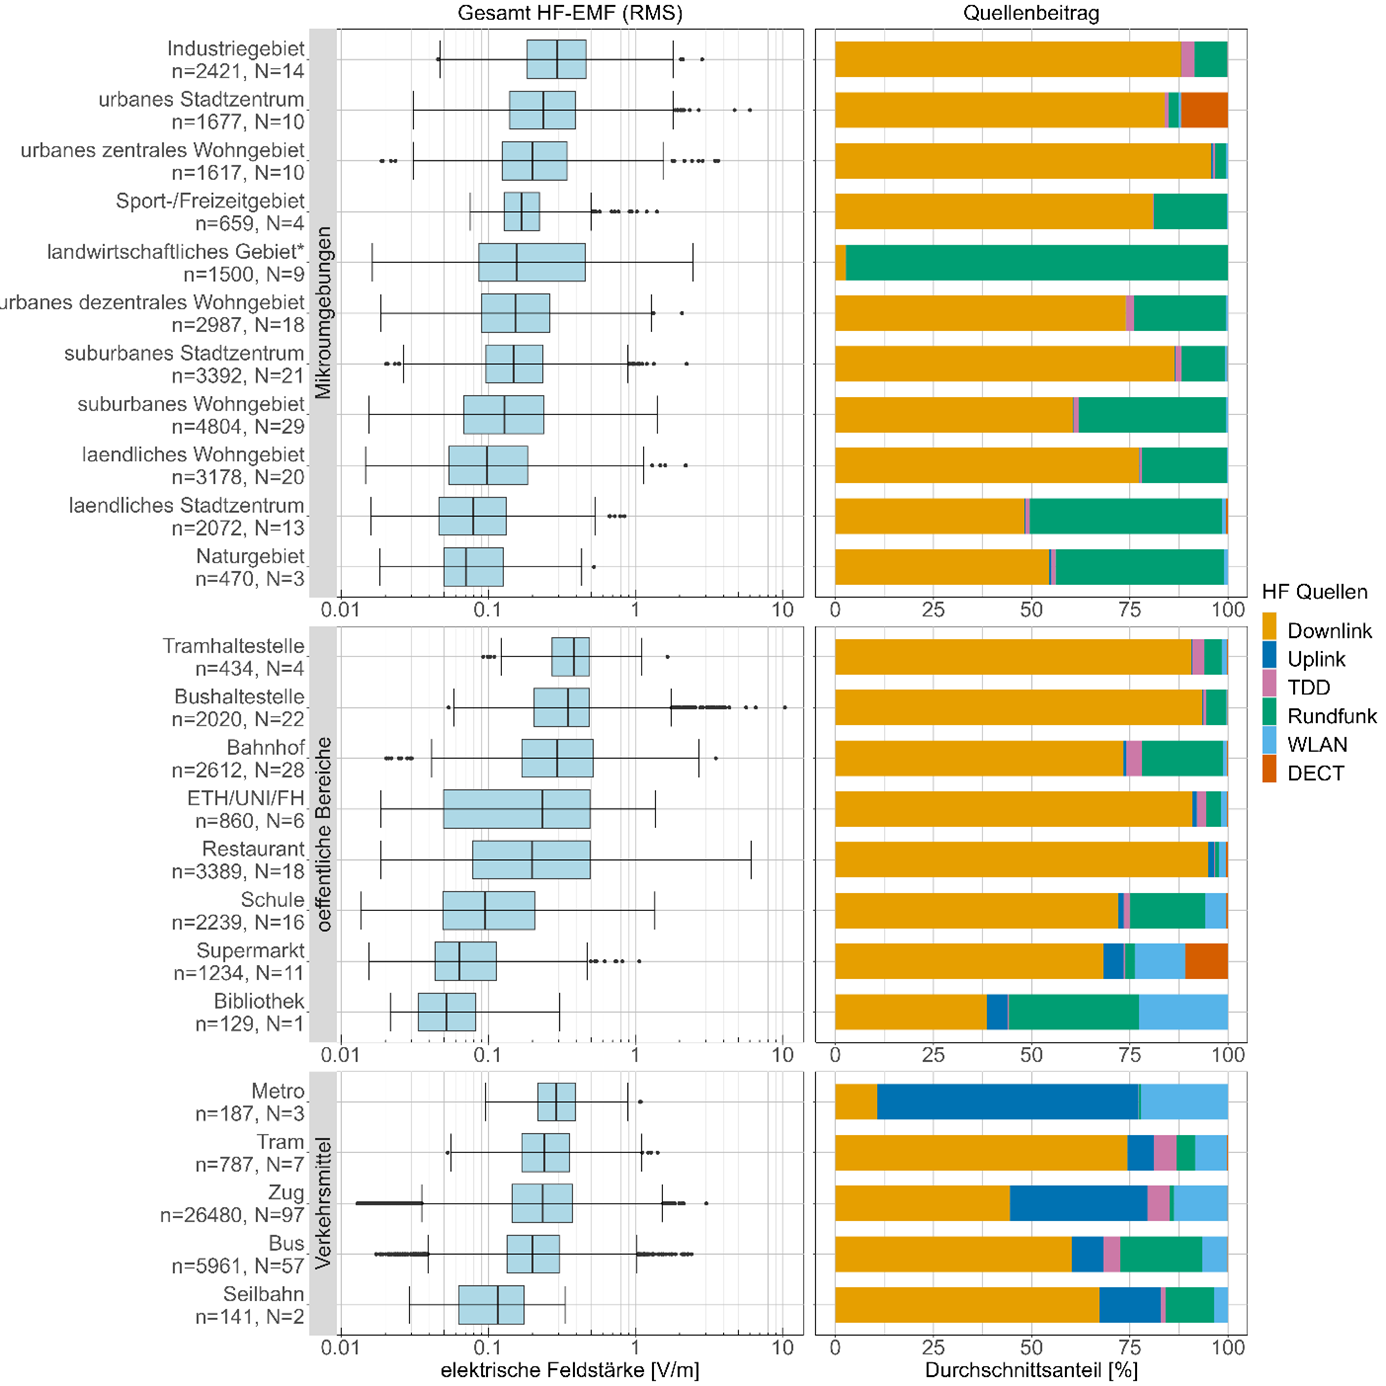
![]() Left panel: Distribution of total RF-EMF (RMS) values in 2022 per measurement environment type. The centre line shows the median and the blue bar the 25th and 75th percentiles. Outliers are outside the 1.5*IQR (interquartile range) and are shown as single points. n denotes the number of data points and N denotes the number of measurement sites. Right panel: Percentage composition of the frequency band groups in the mean total field strength for each measurement environment type. A distinction is made between downlink, uplink, time division duplex (TDD), broadcast, WLAN and DECT.
Left panel: Distribution of total RF-EMF (RMS) values in 2022 per measurement environment type. The centre line shows the median and the blue bar the 25th and 75th percentiles. Outliers are outside the 1.5*IQR (interquartile range) and are shown as single points. n denotes the number of data points and N denotes the number of measurement sites. Right panel: Percentage composition of the frequency band groups in the mean total field strength for each measurement environment type. A distinction is made between downlink, uplink, time division duplex (TDD), broadcast, WLAN and DECT.
It was shown that NIR exposure on trains depends on the occupancy rate. Measurements indoors and in the break areas of schools showed low average field strength values. Outdoors, the main contribution comes from mobile phone systems, and indoors, WLAN also contributes to the total electric field.
The exposure measured in properties is mostly below the installation limit value (AGW), which is a strict precautionary limit value and applies in places of sensitive use (OMEN) such as flats or schools. The median electric field values range from 0.08 V/m to 0.16 V/m and the source composition is dominated by mobile downlink and WLAN. The magnetic flux density measured in homes ranges from 0.05 µT to 0.33 µT.
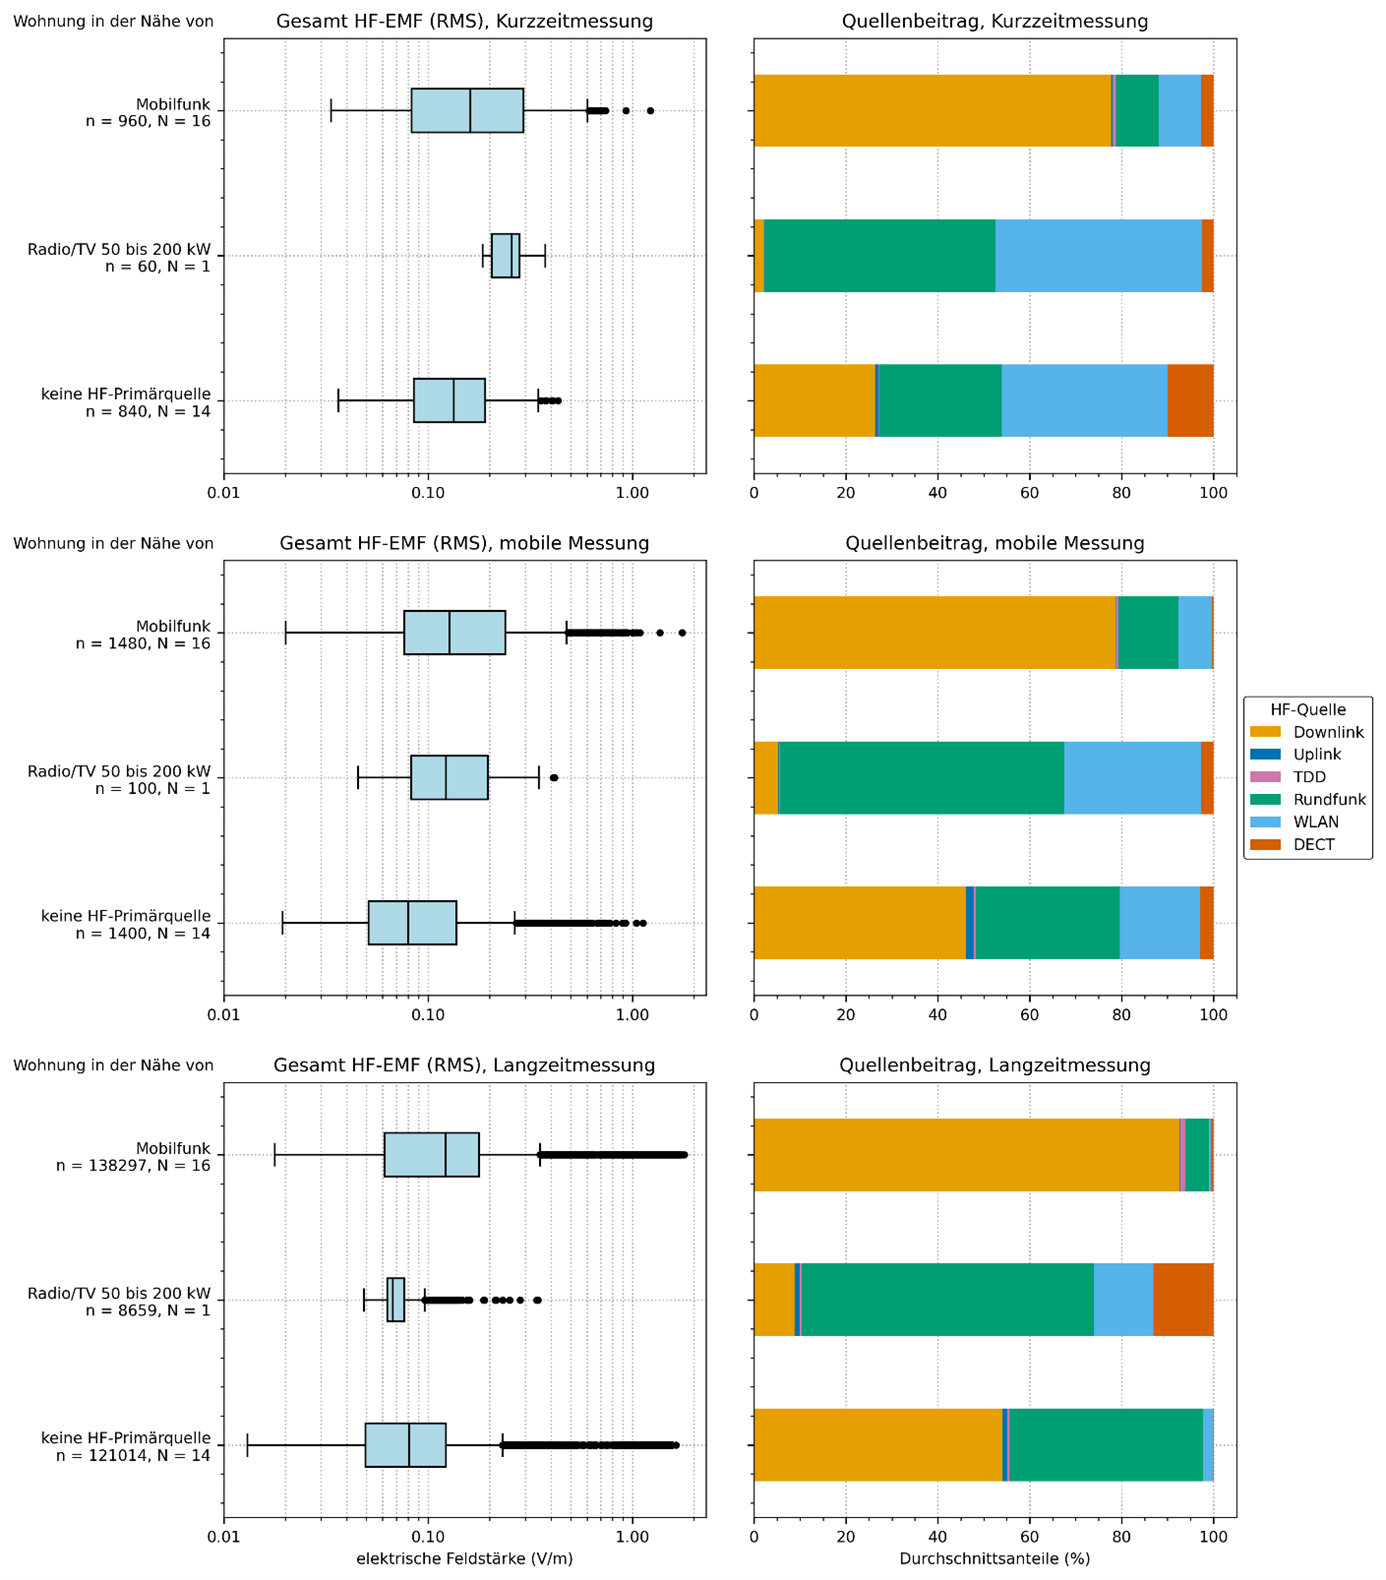
Left panel: Distribution of the total RF-EMF (RMS) values of the spot measurements, grouped by partial measurement (short-term measurement, mobile measurement and long-term measurement) and the primary RF source in the vicinity of the measurement site. For properties that are not in the vicinity of one of the listed RF sources, the category "no primary RF source" is to be selected. The centre line shows the median and the blue bar the 25th and 75th percentiles. Outliers lie outside the 1.5*IQR (interquartile range) range and are shown as individual points. n denotes the number of data points and N denotes the number of measurement sites. Right panel: For all measurement locations with a specific primary source type, the percentage composition of the frequency band groups in the mean total field strength is given. A distinction is made between downlink, uplink, time division duplex (TDD), broadcast, WLAN and DECT.
Do you want to know more precisely what NIR exposure you can expect in your living environment or in public places? Then you will find answers in our report:
https://www.newsd.admin.ch/newsd/message/attachments/82513.pdf
Further information:
- https://www.bafu.admin.ch/bafu/de/home/dokumentation/medienmitteilungen/anzeige-nsb-unter-medienmitteilungen.msg-id-97667.html
- https://www.5g-info.ch/wie-wird-die-belastung-durch-nichtionisierende-strahlung-im-rahmen-des-monitorings-erfasst/
- Nicolas Loizeau, Marco Zahner, Johannes Schindler, Christa Stephan, Jürg Fröhlich, Markus Gugler, Toni Ziegler, Martin Röösli, Comparison of ambient radiofrequency electromagnetic field (RF-EMF) levels in outdoor areas and public transport in Switzerland in 2014 and 2021, Environmental Research, 237, 2023, 116921, https://www.sciencedirect.com/science/article/pii/S0013935123017255
/www.gundp.ch/file/1625/CPX_Jaun_Quadratisch.jpg)
/www.gundp.ch/file/2621/Blog.png)
/www.gundp.ch/file/2849/Data_Science_E.png)